'18. The Social Media Universe
null
View the
full-size version of this graphic!
A Stunning Visual Map of the Social Media Universe
null
View a
high resolution version of this graphic.
It’s hard to believe that social media has emerged as such an expansive ecosystem in just the last 10 years.
The incredible growth of this social media universe can be largely
attributed to the success of Facebook, which has recently hit
two billion
active users globally. But, of course, there are many other platforms
that have helped to build the foundation as well – names like YouTube,
Messenger, WhatsApp, LinkedIn, Reddit, Twitter, Snapchat, and Instagram
all create a powerful base for new apps and add-ons to plug into.
As of today, entrepreneurs have been able to use this foundation to
build out new branches to the social media universe that are both
exciting and diverse. The apps in these niches help to facilitate
workplace collaboration, live events, dating, networking, user reviews,
location-based marketing, livestreaming, expert Q&As, and many other
functions – and the ecosystem continues to expand and multiply by the
day.
What’s Changed in Social Media?
The version of the graphic posted here today is actually the 10th rendition since the concept was first introduced in 2008.
For a trip down memory lane, here’s a copy of the version released in August 2008 as well as a link to the
full-size 2008 graphic as well:
Aside from the ugly, old logos, this graphic is an interesting blast
from the past. It helps us see the evolution of social media, while
reminding us that new additions from the ecosystem can come into their
own as huge successes.
As an example, knowing what we know today, it is almost comical that
the 2008 version lists LinkedIn as a “Niche Network”. Of course, at the
time, it would be hard to see that LinkedIn would eventually boast a
userbase of 500 million professionals and be sold to Microsoft for $26.2
billion as the company’s biggest acquisition of all-time.
There’s also some nostalgic mentions on the list, as well: Ask.com is
the remnants of the glorious Ask Jeeves search engine founded in 1996,
and hi5 was a social network that was the world’s second-biggest in 2007
(after MySpace).
There are similar purchases by other media giants as well....
Visualizing the Future of Media and Entertainment
View the high resolution version of today’s graphic by clicking here.
Over your lifetime, the consumption of media and entertainment has already changed drastically.
For Boomers and Gen Xers, the shift has been earth-shattering. Both
generations will remember a time before mainstream computing when TV was
dominated by the Big Three TV networks (NBC, ABC, and CBS), and
newspapers and magazines were the main way to stay in touch with what
was happening.
Even millennials have seen fundamental shifts in consumption of
media. After all, they experienced the rise of social media, online
news, streaming, and digital video firsthand. Many of them will remember
their college getting access to Facebook for the first time, the death
of Napster, and the funny sounds their 28.8k modem made as it struggled
to successfully download a single image file.
The modern
landscape of media is very different than it was back then – and the coming years will see even more prolific changes.
The Future of Media and Entertainment
Today’s infographic comes to us from
Raconteur,
and it showcases multiple sets of data that help to illustrate the
direction that media is heading. This includes the growth rates of
various media and entertainment sectors, TV viewing trends, and social
media use.
Here are some of the key trends that we found to be compelling:
Annualized Media Sector Growth (Minus GDP Growth) from 2016-2021
 Annualized Media Sector Growth (Minus GDP Growth) from 2016-2021 Chart #1.
Online video (6.0%), online ads (4.3%), and video gaming (2.7%) are the only sectors growing at a rate faster than GDP growth.
But while digital video use is growing, it’s not going to takeover TV anytime soon:
Daily Minutes Watching TV vs. Digital Video Chart #2.
Lastly, here are some figures on the future of media and entertainment that are particularly interesting:
- By 2021, Cisco says that 82% of all internet traffic will stem from digital video
- There will be 26.3 million VR headsets shipped in 2022, up from 100,000 in 2016
- The eSports market will jump 152% in size by 2021
- By 2021, there will be 650 million subscribers to services like Amazon Prime or Netflix
- 5G latency is expected to be 0.001 seconds, which is 15-60x faster than 4G
It’s fair to say that in another decade, media and entertainment will be much less recognizable than what it looks like today.
Lastly, here are some figures on the future of media and entertainment that are particularly interesting:
- By 2021, Cisco says that 82% of all internet traffic will stem from digital video
- There will be 26.3 million VR headsets shipped in 2022, up from 100,000 in 2016
- The eSports market will jump 152% in size by 2021
- By 2021, there will be 650 million subscribers to services like Amazon Prime or Netflix
- 5G latency is expected to be 0.001 seconds, which is 15-60x faster than 4G
It’s fair to say that in another decade, media and entertainment will be much less recognizable than what it looks like today.
null
Explore the high resolution version of this graphic
This Map Compares the Population of the Real World vs. Social Media
When you log on to Twitter or LinkedIn, it feels like you are connected to everyone on Earth.
Whether you want to get a taste of culture from other continents, or
you want to stay on top of the latest opportunities and events in far
flung places – social media allows you to connect with anyone with
similar interests, no matter where they are located.
But how representative is the social media world of the real population, exactly? Today’s infographic from
Raconteur breaks it all down.
Quantifying the Social World
There are roughly 2.8 billion social media users in the world – a penetration of about 37%, according to a
recent report by Hootsuite.
Socialmedia World Population vs Actual Population
Socialmedia Population vs Actual Population Chart #3.
While there are not many surprises here, things get more interesting as we dive deeper into the data.
Specifically, as we break down Asia-Pacific’s massive population and
level of social media penetration, you’ll see that sub-regions have
attributes that are quite different.
Percent of Global Socialmedia Users vs Percent of Actual Population
% of Global Socialmedia Users vs % of Actual Population Chart #4.
The regions with plus numbers (i.e. North America, +3%) have a higher
proportion of social media users relative to their actual population.
The areas with negative numbers (i.e. Africa, -10%) have less people on
social media than one would guess from their total population. These
latter areas are also where social media will likely encounter the most
growth in users in the near future.
The different sub-regions in Asia are particularly interesting to
look at. East Asia is the most “over-represented” population in the
social media world with a +11% differential. Meanwhile, neighboring
South Asia (-15%) and Southeast Asia (+2%) are two regions that don’t
have nearly as many people connected through those mediums.
null
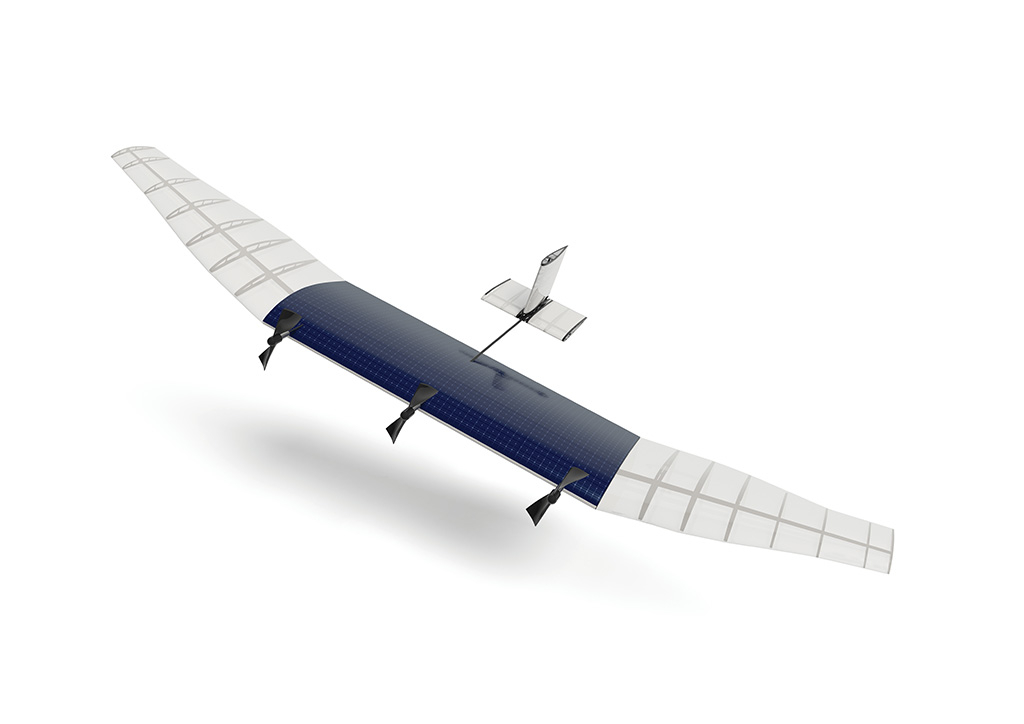
Facebook has set up a team to work on solar powered aircraft.
Googles & facebook's Battle for the Rest of the Population
As you probably know
Google & facebook are working to connect the rest of the world's population roughly 2/3 .or. 66.33% of current population.
Facebook has set up a team to work on solar powered aircraft that would
circle at a height of 20 kilometers to provide Internet access to
suburban areas of the world where connectivity is scarce.
We are becoming increasingly more dependent on the internet to help run our lives. But much of the planet is outside the web, zones that are without web coverage. Ordinarily, this is more of a nuisance than a calamity. But in the aftermath of disasters, restoring internet coverage can be the difference between life and death.
The only trouble is, that’s territory already staked out by Google for the
fleet of high altitude balloons at the heart of its own plan to improve access to the Internet in poor regions of the world. Google has carried out
test flights of the balloons already, and says they will operate at between 18 and 27 kilometers (11.1847 to 16.777 miles) above the Earth.
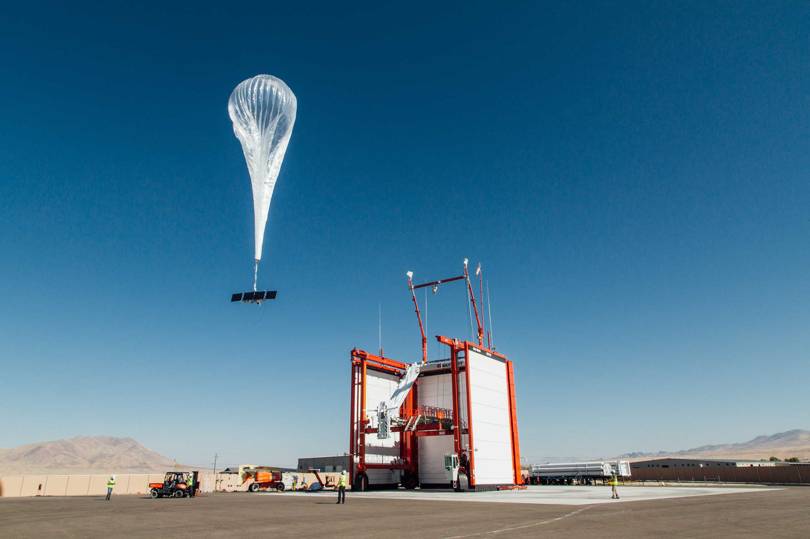
A balloon launches from Loon's launch site Winnemucca, Nevada.
A Loon balloon wafting towards its test area.
Both companies have chosen those heights because they put their
craft far above weather and commercial air traffic. Neither has said
anything about how their balloons or drones might detect and avoid one
another.
A person waits for a data connection beneath the MTN tree in
Mwandi District, Zambia.
Google and Facebook have also settled on different modes of
transporting data back down to Earth. Google’s trials have used radio to
link the balloons to volleyball-sized antennas mounted onto homes or
businesses. Facebook has plans to equip its drones with infrared lasers,
which can be used for data connections approaching the speed of fiber
optic cables. The company is also interested in using satellites the
same way.
Internet cafes are a rare breed in any of the developing countries with a growing number of
smartphone users, but the main town squares on all major islands i.e. Cape Verde Islands (Cabo
Verde), Africa have free wi-fi. Cape Verde is one of the poorest country in Africa. Note that some hotels, even the upscale ones,
charge for wi-fi.
My first question when I looked at the maps, charts of social media was:
Where is
Visual Capitalist?
Is it not a social media?
Probably not if what defines social media is the art of networking. I guess folks like Brian Solis and JESS3 who create these maps, overlooked quantum physics and left the perspective void. How do we create a 3D component that brings the message out of the box and puts it in a social perspective? We look at these maps of social media using Visual Capitalist as a time-space-scope-continuum (or a mediascope perhaps?), 'read the comments and respond,' and that makes it interactive, maybe not social but interactive.
Visual Capitalist is from my perspective one of the best tools in journalism, but it makes it even more dynamic because it gives us space to feed back other readers, and the authors. So, even if Visual Capitalist is not a social media, it is the best interactive qualitative analysis of facts (it is also a good broad picture when it comes to quantity). As in any other market, branding and taste are two very powerful signals to attract customers, from Google´s minimalism to Linkedin's complexity, every social media application has its niche.
The art of maximizing the "social" component has been just as broad as the variety of media, and while some media are made to ease our expenses networking, others are made to be a luxury. One sure thing is that, the more public I go, the more responsible I ought to be towards the content. Freedom is too complex as a term to be used freely.